Transforming neighborhoods through resident involvement all began with Roosevelt Park.
Learn more about the Our Neighborhood, Our Health Roosevelt Park Stakeholders & Community Advisory Board.
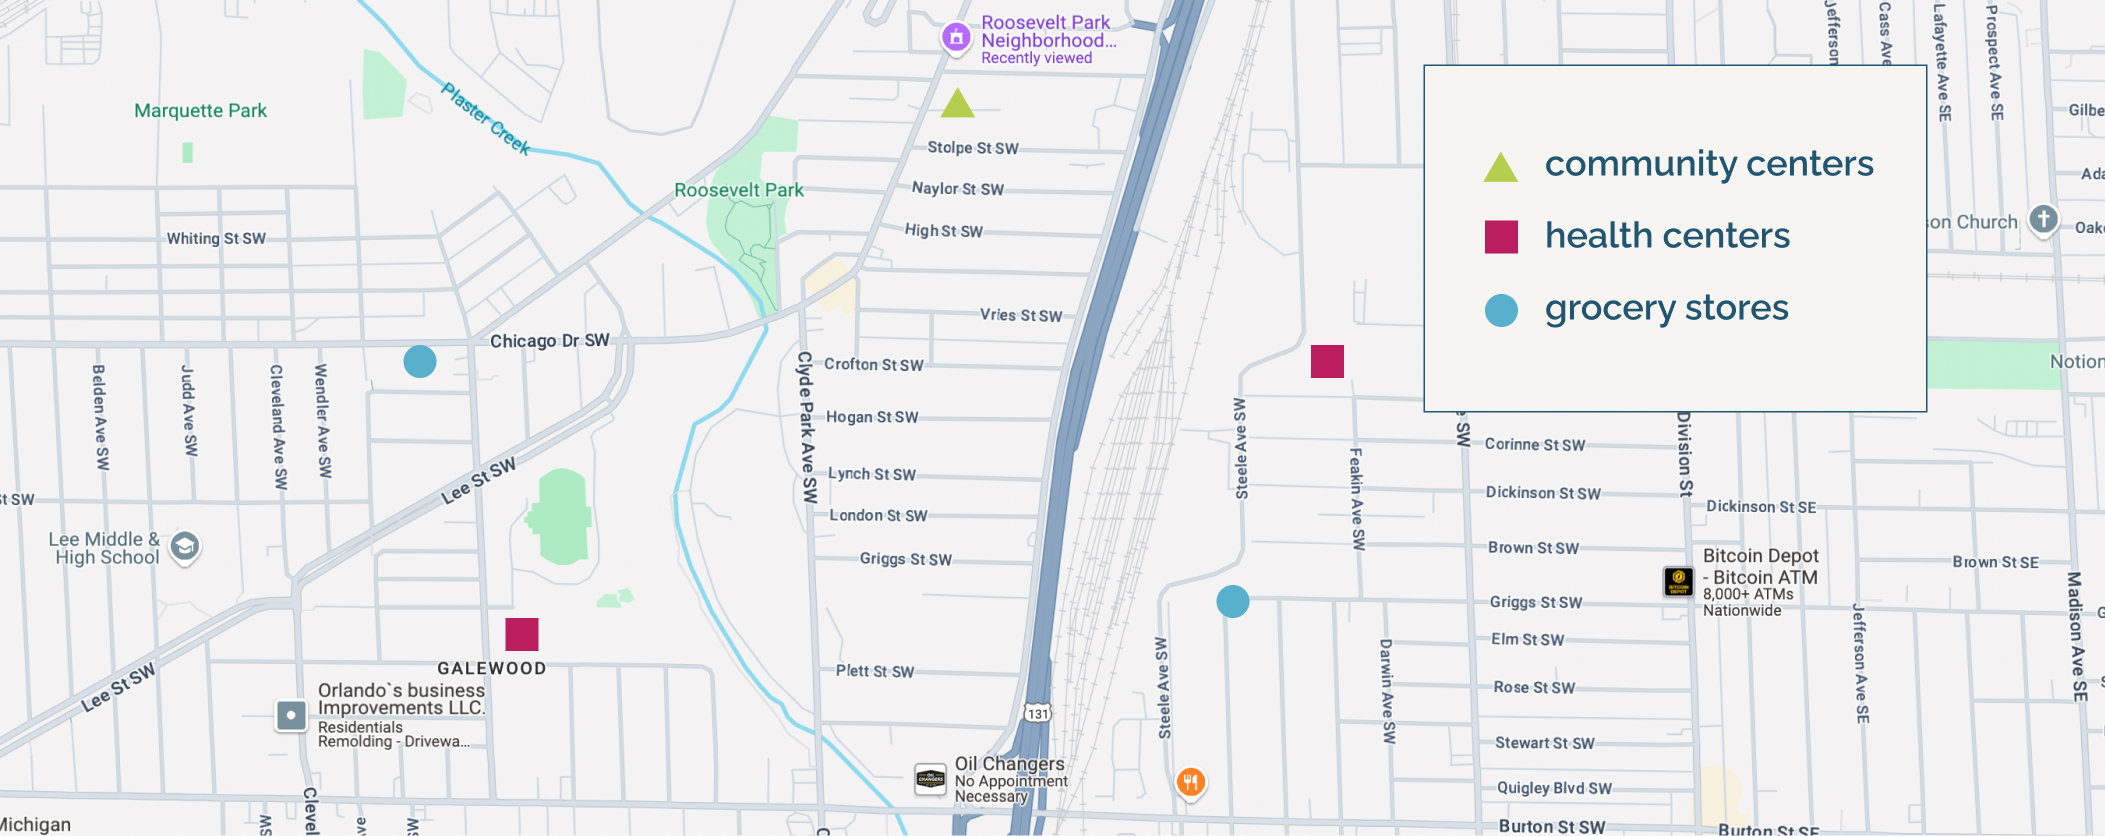
Map of the Roosevelt Park neighborhood
No Data Found
No Data Found
In June 2022, three focus groups were conducted with community residents to gather their insights and opinions on the neighborhood’s strengths, concerns, and views on health. These discussions were instrumental in ensuring that the initiative was grounded in the lived experiences and perspectives of community members.
Thirty-two residents participated in focus groups. The demographic information of residents is as follows:
Loading..........
The Data is Not Available
Loading..........
The Data is Not Available
A summary of findings includes:
Various community and neighborhood resources (organizations, services, parks, activities)
3/3 focus groups and 16/32 participants referenced this theme
Walkable neighborhoods/things are close by and accessible
3/3 focus groups and 13/32 participants
Quiet/peaceful neighborhood
3/3 focus groups and 09/32 participants
Business district
3/3 focus groups and 07/32 participants
People know each other, support each other, and watch out for each other and there is a family atmosphere in the neighborhood
3/3 focus groups and 06/32 participants
Diversity
2/3 focus groups and 05/32 participants
Neighborhood schools
2/3 focus groups and 04/32 participants
Safety of children crossing the street, particularly to school
3/3 focus groups and 10/32 participants
Housing (high cost, overcrowding, availability, environmental concerns such as pests, mold, and lead)
2/3 focus groups and 07/32 participants
Undocumented resident concerns (employment, fear, transportation, housing legal assistance)
2/3 focus groups and 06/32 participants
Cost of living / daily living expenses
2/3 focus groups and 03/32 participants
Employment
2/3 focus groups and 02/32 participants)
Lack of transportation
1/3 focus groups and 03/32 participants
Clinica Santa Maria
3/3 focus groups and 17/32 participants
The hospital / ER / urgent care
3/3 focus groups and 07/32 participants
Cherry Street
3/3 focus groups and 06/32 participants
Exalta Health
1/3 focus groups and 03/32 participants
Cost of care/insurance
3/3 focus groups and 07/32 participants
Long wait for appointments
2/3 focus groups and 07/32 participants
Lack of transportation
2/3 focus groups and 02/32 participants
Language barriers
1/3 focus groups and 05/32 participants
Mental Health
3/3 focus groups and 09/32 participants
Diabetes
2/3 focus groups and 06/32 participants
Obesity/overweight
2/3 focus groups and 04/32 participants
Violence /domestic violence/suicide
2/3 focus groups and 04/32 participants
Nutrition for children
2/3 focus groups and 03/32 participants
Lack of preventative care
1/3 focus groups and 04/32 participants
COVID and stress connected to COVID
1/3 focus groups and 04/32 participants
Environmental health concerns (mold, lead)
1/3 focus groups and 03/32 participants
Crime and feeling unsafe
3/3 focus groups and 13/32 participants
Liquor stores and concerns about public intoxication
3/3 focus groups and 04/32 participants
Traffic and pedestrian safety
2/3 focus groups and 10/32 participants
Lack of enough streetlights
2/3 focus groups and 08/32 participants
Lack of green space
2/3 focus groups and 04/32 participants
Lack of a pharmacy in the neighborhood
2/3 focus groups and 04/32 participants
Streets need repair
2/3 focus groups and 04/32 participants)
The GRPD (makes people in the neighborhood feel unsafe, they don’t respond, or come late)
2/3 focus groups and 03/32 participants
Concern about safety for kids both at home and at school
1/3 focus groups and 05/32 participants
Racism/discrimination
1/3 focus groups and 04/32 participants
Lack of activities for kids to do including lack of childcare centers
1/3 focus groups and 04/32 participants
Increase in the number of unhoused individuals noted in the neighborhood
1/3 focus groups and 04/32 participants
Neighborhood stigma
1/3 focus groups and 03/32 participants
Lack of information about resources
2/3 focus groups and 07/32 participants
Language barriers and inability to read and/or write
2/3 focus groups and 06/32 participants
Amplify resident voices
2/3 focus groups and 06/32 participants
Seeing community change/community improvement
2/3 focus groups and 04/32 participants
Support residents in playing an active role (share information about opportunities, increase opportunities, remove barriers such as transportation and childcare, offer opportunities outside of work hours)
2/3 focus groups and 04/32 participants
Safer Community
3/3 focus groups and 19/32 participants
More activities for kids/youth and more childcare
3/3 focus groups and 08/32 participants
Everyone can be heard/have a voice / and it drives community change
3/3 focus groups and 07/32 participants
More bilingual support from community / ESL classes
3/3 focus groups and 06/32 participants
More mental health resources
2/3 focus groups and 03/32 participants
Equality
2/3 focus groups and 02/32 participants
More pharmacies in the neighborhood
1/3 focus groups and 05/32 participants
More information/communication about resources
1/3 focus groups and 03/32 participants
Next a door-to-door community survey was conducted between August and November of 2022.
112 people were surveyed, with questions in the areas of:
“…there are not a lot of private landlords anymore. So, it makes it hard for people and the price is so high.”
Roosevelt Park Focus Group Participant
No Data Found
No Data Found
“…the quality of the house like they don’t fix them they are infected with roaches or rats…”
Roosevelt Park Focus Group Participant
No Data Found
112 Total Respondents
No Data Found
No Data Found
Source: Based on survey data of Roosevelt Park residents collected by Corewell Healthier Communities
“The difficult thing is when people don’t drive, or, well, it’s hard to get a ride there. ”
“…There are no jobs close by. And we always have to go to something far away, we need a ride and some of us don’t drive, right? And we have no one to take us all the way there. Yes, that’s true…”
“And now with all that’s going on, prices going up, gasoline, rent, bills, trash, everything. [another resident says] everything went up.”
Roosevelt Park Focus Group Participant
No Data Found
Based on the results of the survey and focus groups, residents identified three priorities in the areas of health, mental health, and public safety.
31 percent of all respondents report they do not have health insurance.
4.2 percent of Kent County residents report not having health insurance.
64 percent of survey respondents indicated they have at least one person in their household with a chronic condition.
The top five health conditions identified were:
50 percent of the survey respondents indicated they do not receive medical care when needed.
20 percent of respondents reported language barriers with health systems when they tried to access medical care.
38 percent of respondents indicated that they have signs of depression, anxiety, worry, and/or lack of interest.
18 percent of respondents indicated feeling anxious or nervous every day.
15 percent report fighting depression every day.
46 percent of respondents indicated that they felt public safety was either a major issue (23%) in the community or somewhat (23%) of an issue.
66 percent of respondents report that traffic is a major issue (35%) in the community or somewhat of an issue (31%).
48 percent of respondents indicated that gun violence was a major issue (29%) within the community or somewhat of an issue (19%).
50 percent of respondents indicated that more policing was necessary in the neighborhood for them to feel safe.
Some questions on the Our Neighborhood Our Health survey were written to match the Behavioral Risk Factor Surveillance Survey (BRFSS). Below is the county and state level BRFSS data for the questions that align with the ONOH survey.
No Data Found
*Our Neighborhood Our Health survey asked about diagnosis of any mental health condition; comparison data include diagnosis of a depressive disorder only
**County and state comparison data for obesity is based on BMI classification, not “obesity” diagnosis
No Data Found
No Data Found
*Kent County and MI BRFSS estimates based on question: “do you have one person you think of as your personal doctor or health care provider?”


